Published on Sept. 20, 2019
Breaking down the genetic improvement formula
Unlocking the Potential of the Best Egg Laying Hens: How Breeding Strategies Drive Genetic Progress
Behind every high-performing layer is a carefully calculated plan. At Hendrix Genetics, our success in delivering the best egg laying hens is no coincidence—it’s the result of decades of advanced breeding strategies in animals, backed by science, data, and dedication. In this article, we break down the formula behind continuous genetic improvement, showing how innovations like progeny genetic testing, selection for traits such as egg shell strength, and a clear focus on sustainable poultry farming are shaping the future of egg production. Discover how these proven breeding strategies come together to create laying hens that consistently perform and add value to the entire global egg industry, generation after generation.
In poultry breeding, consistent genetic progress doesn't happen by chance—it follows a proven path. The genetic improvement formula is the cornerstone of developing the best egg laying hens, no matter which trait is targeted or which tools are used. At Hendrix Genetics, this formula guides our work to support sustainable poultry farming and long-term performance in commercial layers.
The Genetic Improvement Formula
At its core, the formula can be simplified to this:
Genetic gain = Accuracy × Selection Intensity × Genetic Variability / Generation Interval
Let’s explore how each of these elements contributes to building stronger, more productive hens.
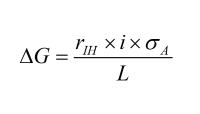
Accuracy: The Power of Reliable Data

The more data we collect, the higher the accuracy of our selection decisions. This is why we measure key traits that directly reflect our breeding goals—such as egg shell strength, egg weight, and persistency. When a specific trait can’t be measured directly, we use highly correlated traits instead.
To ensure accuracy under real-world conditions, we don’t rely solely on pure line farm data (from ideal environments); we also gather performance data from progeny genetic testing on field test farms. This combination helps us create hens that thrive not only in theory, but in practice—on farms around the world.
Advancing Phenotyping with Technology
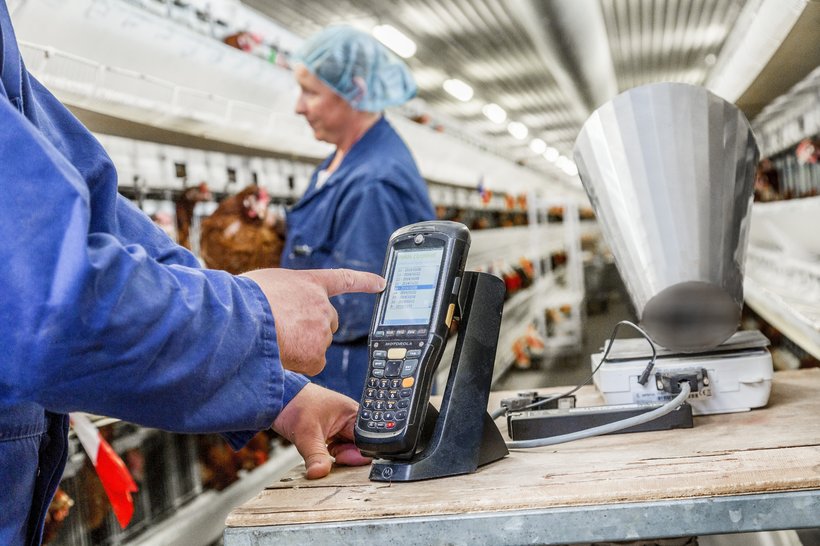
New tools are revolutionizing how we collect phenotypic (observable) data. For example:
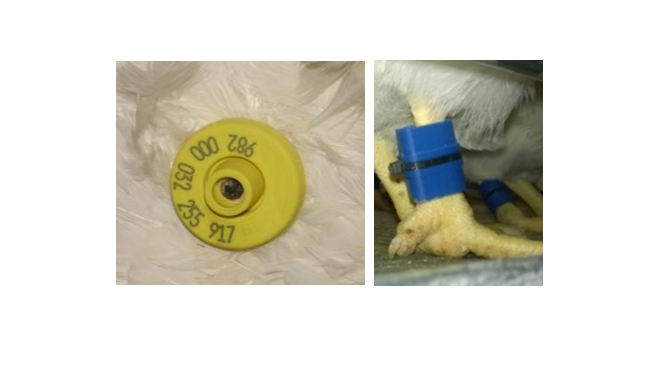
- RFID tags, attached to a hen’s wing or leg, track behaviors like oviposition time, nest visits, and time spent in the nest.
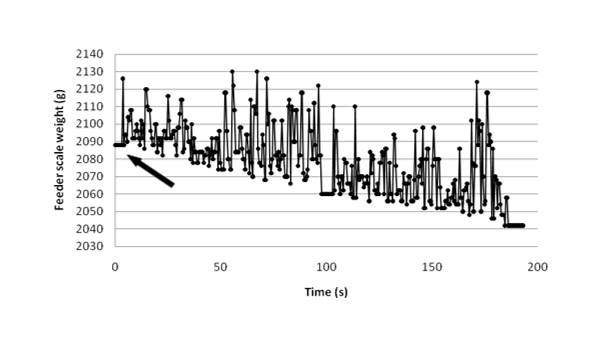
- Automatic feed stations capture data on feeding time, visit frequency, and even pecking strength—giving us a better understanding of feed efficiency and behavior.
These innovations support breeding strategies in animals that are both more data-rich and more precise.
Automating Egg Quality Analysis
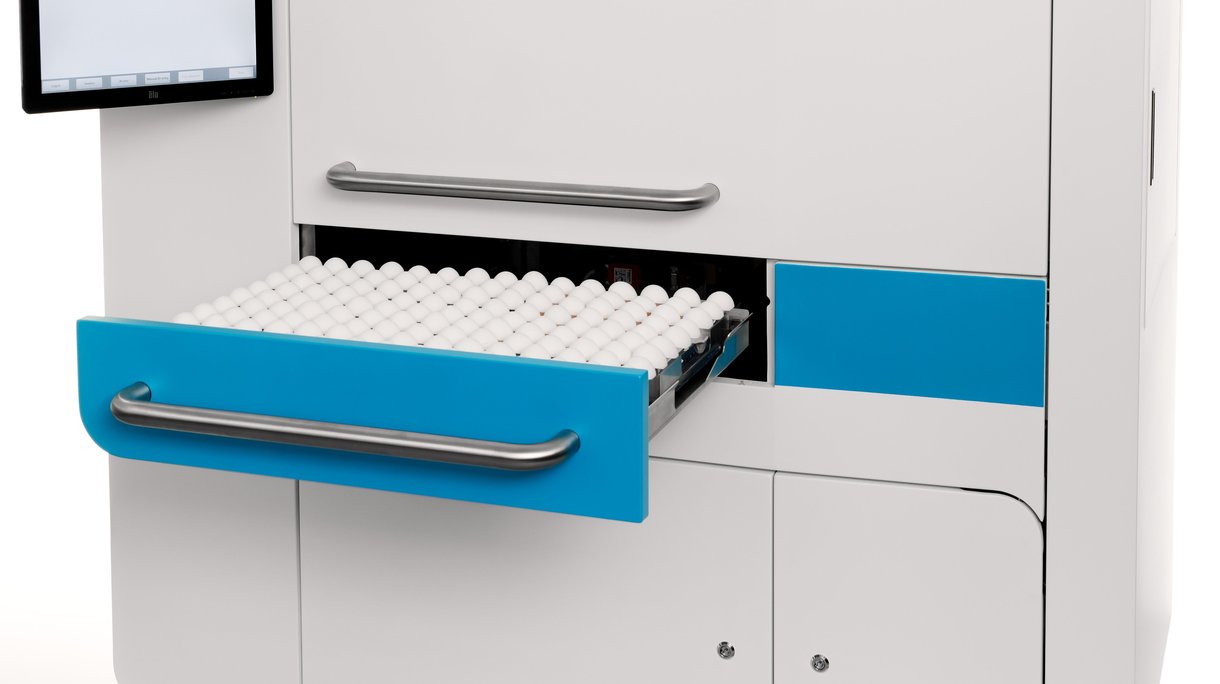
To further increase the number and consistency of egg quality measurements, we developed the Eggxaminator—an advanced egg robot. This custom tool automatically measures multiple egg production traits, including egg shell strength, with unmatched accuracy. It allows us to identify superior layers and accelerate progress toward more durable, productive hens.
Selection Intensity: Choosing the Best of the Best

Selection intensity refers to how strict we are when selecting breeding candidates. For example, if the goal is to improve egg shell strength, selecting the top 20 hens out of 2,000 will result in greater progress than selecting the top 200. The narrower the selection, the higher the average performance of the chosen birds—creating faster genetic gains.
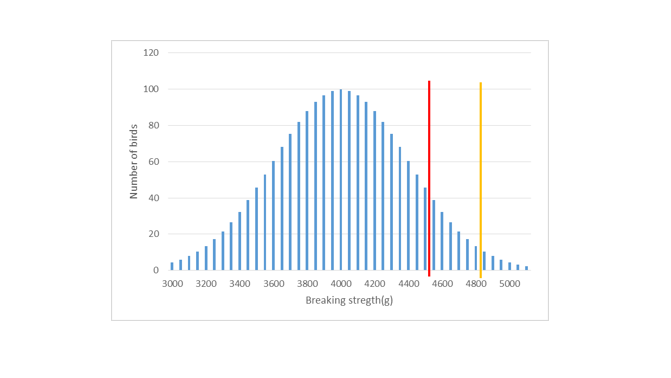
Genetic Variability: The Raw Material of Progress
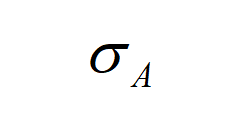
Without genetic variability, there is nothing to select for. Populations with broader genetic variation offer more opportunities to find extreme individuals that align with our breeding goals. This variability is critical in our mission to improve egg production traits and create birds suited for different markets and production systems.
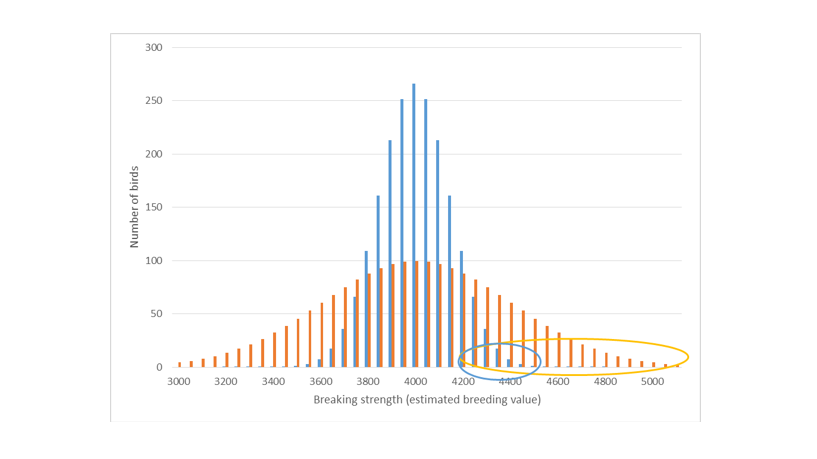
Generation Interval: Time is a Factor

The generation interval—how frequently breeding stock is renewed—also affects progress. All else being equal, reducing the interval from one year to six months can double the rate of genetic improvement. That’s why our breeding programs are designed to balance performance with efficiency, ensuring continual innovation without compromising long-term genetic health.
A Long-Term Commitment to Sustainable Progress
At Hendrix Genetics, our mission is to support sustainable poultry farming through science-driven innovation. The genetic improvement formula isn’t new—but our tools, insights, and technologies are evolving rapidly. With each advancement, we move closer to developing even better breeding strategies that empower egg producers to succeed—today and in the future.

